

This post was contributed by Coraleap, one of our Discord members. Give them a follow!
Right now, Democrats seem to be in a good position going into November. The ElectionCord generic ballot sits at D+6.2. Democrats have done well in off-cycle elections and have outperformed partisanship in special elections. Younger voters, racial minorities, and people without a college education seemed to be driving Democratic persuasion. It’s a perfect time to have one of our cyclical traditions: trying to parse Washington’s August top-two open primary.
Historically, the Washington Primary has been used as an additional bellwether for elections. While not perfect, it is a good predictor of how some districts will vote in the upcoming general election and a decent predictor of the national environment, or at least the environment in the Pacific Northwest. As we will explain later, it is slightly worse than polling aggregates at predicting the national environment, but still good enough to indicate uncertainty when polling may be off.
This year, the Washington Primary suggests strong results for Democrats. These results are slightly stronger for Democrats than current polls indicate, with the divergence coming from better-than-expected performances among white, college-educated voters. In this article, I will explain the history of the Washington top-two primary and how it should affect your priors for November.
Studying the Washington Primary’s Past
The Washington Primary is widely seen as being predictive of the upcoming general election’s partisanship. The state’s use of universal mail-in voting, the jungle primary system, and relative lack of high-stakes statewide battles that attract high primary spending make the primary electorate mostly stable. Washington also has a whiter and more college-educated population than the nation as a whole, so the primary’s partisanship in most areas of the state is usually similar to the general election partisanship. Other states with jungle primaries (CA, AK) do not satisfy these conditions, leading to shifts like this1.
The lone exception to this trend is in the Yakima Valley in WA-04, where the working-class majority-Hispanic towns have low primary turnout. In some parts of this area, approximately 7% of their population turns out for their primaries (as opposed to 20–30% in other areas). Similar to California’s Central Valley, primary partisanship here doesn’t always track with general election partisanship as lower-propensity voters get more engaged for the general election, so we can expect some shifts in November.
The State’s Primary-to-General Shift
For each election since 2008 (when the top-two system was put into effect), I tabulated the primary-to-general election swing of each Congressional District (ignoring races where the general election wasn’t a Republican vs. a Democrat)
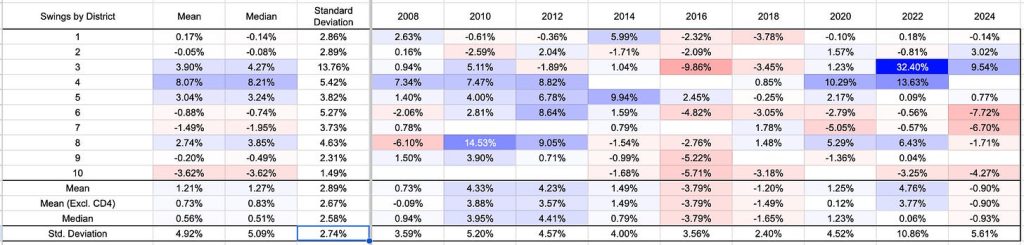
On average, the Washington Primary is ~1% redder than the general election. The standard deviation of ~2.8% seems large, but it’s slightly less than a heavily polled state’s polling error. For individual districts, the standard deviation of this shift is closer to 6%, reflecting the unique primary dynamics in different races. Some of these exceptions can be singled out.
In WA-04, the main dynamic at play is strategic voting on the part of Democrats. The district is very red, so many Democrats will opt for a more moderate Republican to prevent the election of a more radical candidate like Jerrod Sessler. These shifts may also be exacerbated by low Hispanic turnout in the primary. In 2018, the only time when the district did not see a massive leftward shift from the primary to the general, there was only one Republican in the primary. Thus, strategic voting was not a factor in that year.
The other glaring exception here is 2022 WA-03. Here, there was a high-profile primary battle between Jamie Herrera Beutler, a Republican who voted to impeach Donald Trump, and January 6th attendee Joe Kent. Herrera Beutler got locked out of the general election by Kent and Democrat Marie Gluesenkamp-Perez (MGP). Some Democrats likely voted to save Herrera Beutler, and MGP successfully eked out a victory in the light-red district by portraying Joe Kent as an extremist and herself as a working-class moderate.
In addition to these district-specific misses, we also have three notable cycles where there was a major shift from a primary election to a general election. I personally do not know what caused these shifts, so I will do my best to explain them.
In 2012 and 2016, we may be able to attribute this to popular opinion shifting towards both Obama and Trump later in the campaign trail, with their coattails carrying their party’s candidates along with them in the general election. Public opinion likely fluctuated wildly in the last three months of these respective presidential campaigns.
For 2010, we might be able to attribute this shift to the fact that the Tea Party movement fueled high Republican primary turnout across the nation. Washington was no exception. I have also been told that the competitive Senate election during the general election probably drove up urban turnout, allowing Democrats to recover some margin.
Ultimately, it would be difficult to conclusively explain these cycle-specific primary misses. Washington doesn’t have partisan voter registration, so it’s quite difficult to determine which people vote in primaries. Perhaps the primary overestimates the out-of-power party in wave elections? We don’t know for sure.
Washington’s relationship to the national environment

Using the primary election to predict the national House vote is a bit trickier since Washington doesn’t always trend with the nation. We can still try to predict the national environment with two methods:
- Taking Washington’s primary vote and subtracting its estimated calculated partisan lean (here simply using the previous election cycle’s SHAVE as calculated by Split Ticket)
- Taking districts which had a general election last cycle, estimating their shift, their mean/median, and shifting the previous cycle’s environment by that amount. (This can be done with previous cycles as well if desired.) This works somewhat worse when reapportionment is involved.
Both approaches generally produce similar results. Above, we use the second approach and show the difference between the estimated national environment based on the primary and general elections and the actual national environment. My preferred method here is to remove the districts that swing the most towards each party and take the mean shift of the rest. Other reasonable approaches are shown in the sheet as well.
The standard deviation of the “miss” hovers at around 4.5% for both approaches, making it somewhat worse than pre-election polling at pinning down the national environment. Of course, it is generally very difficult to predict polling errors. The advantage here is that we can sometimes try to predict when Washington may trend to the left of the nation, for example.
The Primary Results
Overview
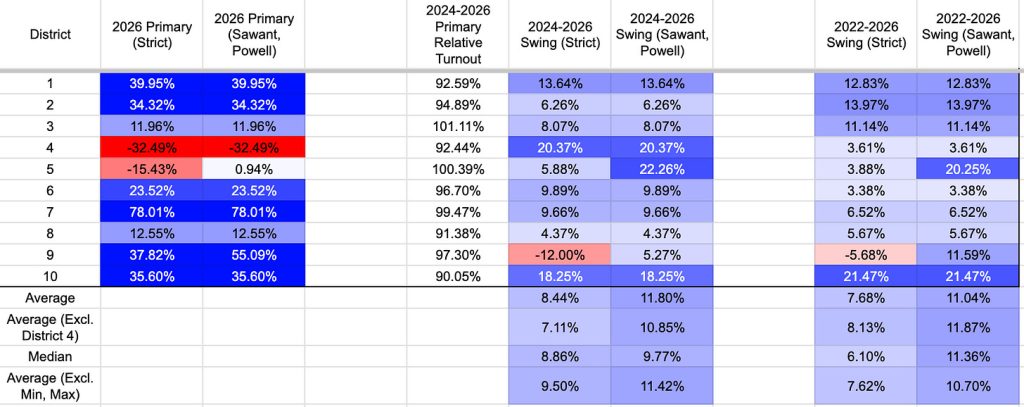
In the 2026 primary, Democrats combined for roughly 60% of the popular vote, while Republicans combined for roughly 36%. This nets to a roughly D+23.5 topline for Democrats. If votes from Independent candidates Nate Powell and Kshama Sawant are included (both candidates found strong backing from Democratic-aligned and DSA-aligned groups respectively), the Democratic margin is closer to D+27. Each district is shifting 7–12 points to the left from 2022 to 2024.
In my opinion, it is probably better to count these candidates as Dems than not. Powell and Sawant are left-leaning, with Powell being a progressive independent and Sawant being a socialist. Both found strong backing from Dem-aligned/DSA-aligned groups, so it’s fair to assume that most of their voters are Democrats.
Regional Trends
Below is the 2022 Congressional to 2026 Primary swing map by 100K District (or, as best as I can get it right now). Using the 100K Districts allows us to see “blocks” of voters and regions that have moved without the noise of individual precinct data. The reason I use this baseline (instead of 2024 Presidential) is that most of the Washington incumbents won their respective elections in 2022 and that 2024 had two single-party congressional general elections. If you wanted to compare with 2024 Presidential results, the map looks pretty similar. Kshama Sawant and Nate Powell are counted as Dems here.
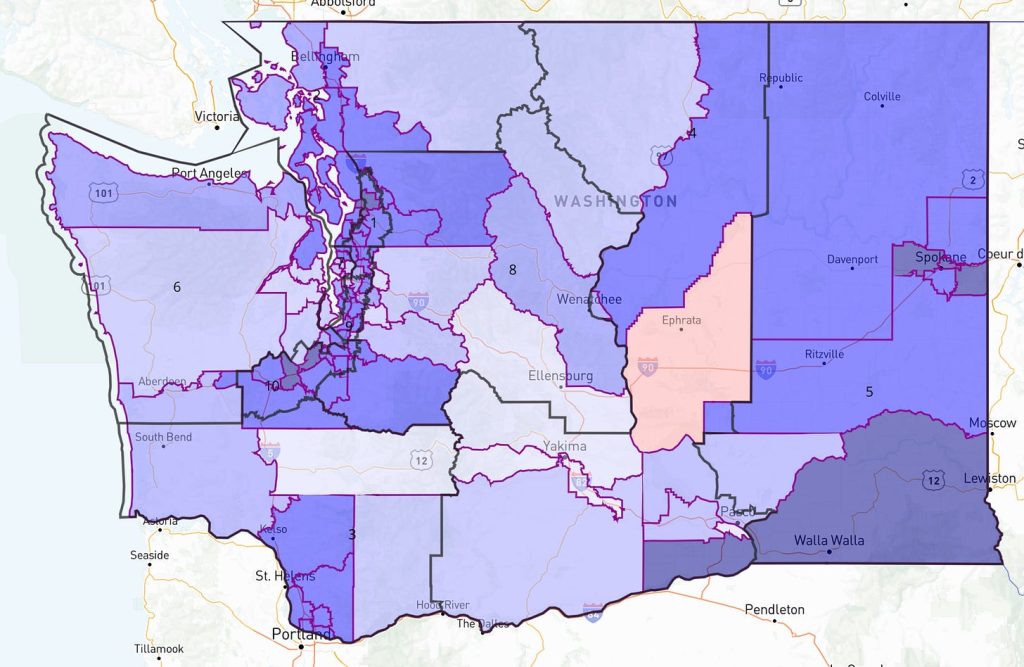
Interestingly, the strongest pro-Democratic shifts are concentrated in the suburbs. Although the shifts are somewhat stronger in the more diverse, working-class suburbs in the Tacoma/Olympia area, the shifts in whiter suburbs and ones with high college attainment are very strong as well. Democrats also show strength in small towns, both on the eastern part of the state and the western side. This strength seems consistent across different Congressional Districts. The shifts in the suburbs seem to range between 10 and 15 points, mildly more than the state as a whole.
One caveat here is that the Seattle suburbs were 1–3 points more favorable for Democrats in the 2022 and 2024 primaries than their respective general elections, suggesting that perhaps Democrats’ suburban numbers are slightly too rosy. This effect is too weak to change our conclusion in this section.
In the figure, we also notice weak Democratic performance through Congressional District 4 relative to 2022. However, given the aforementioned primary dynamics in the district, it’s difficult to read into this.
Washington’s 3rd District
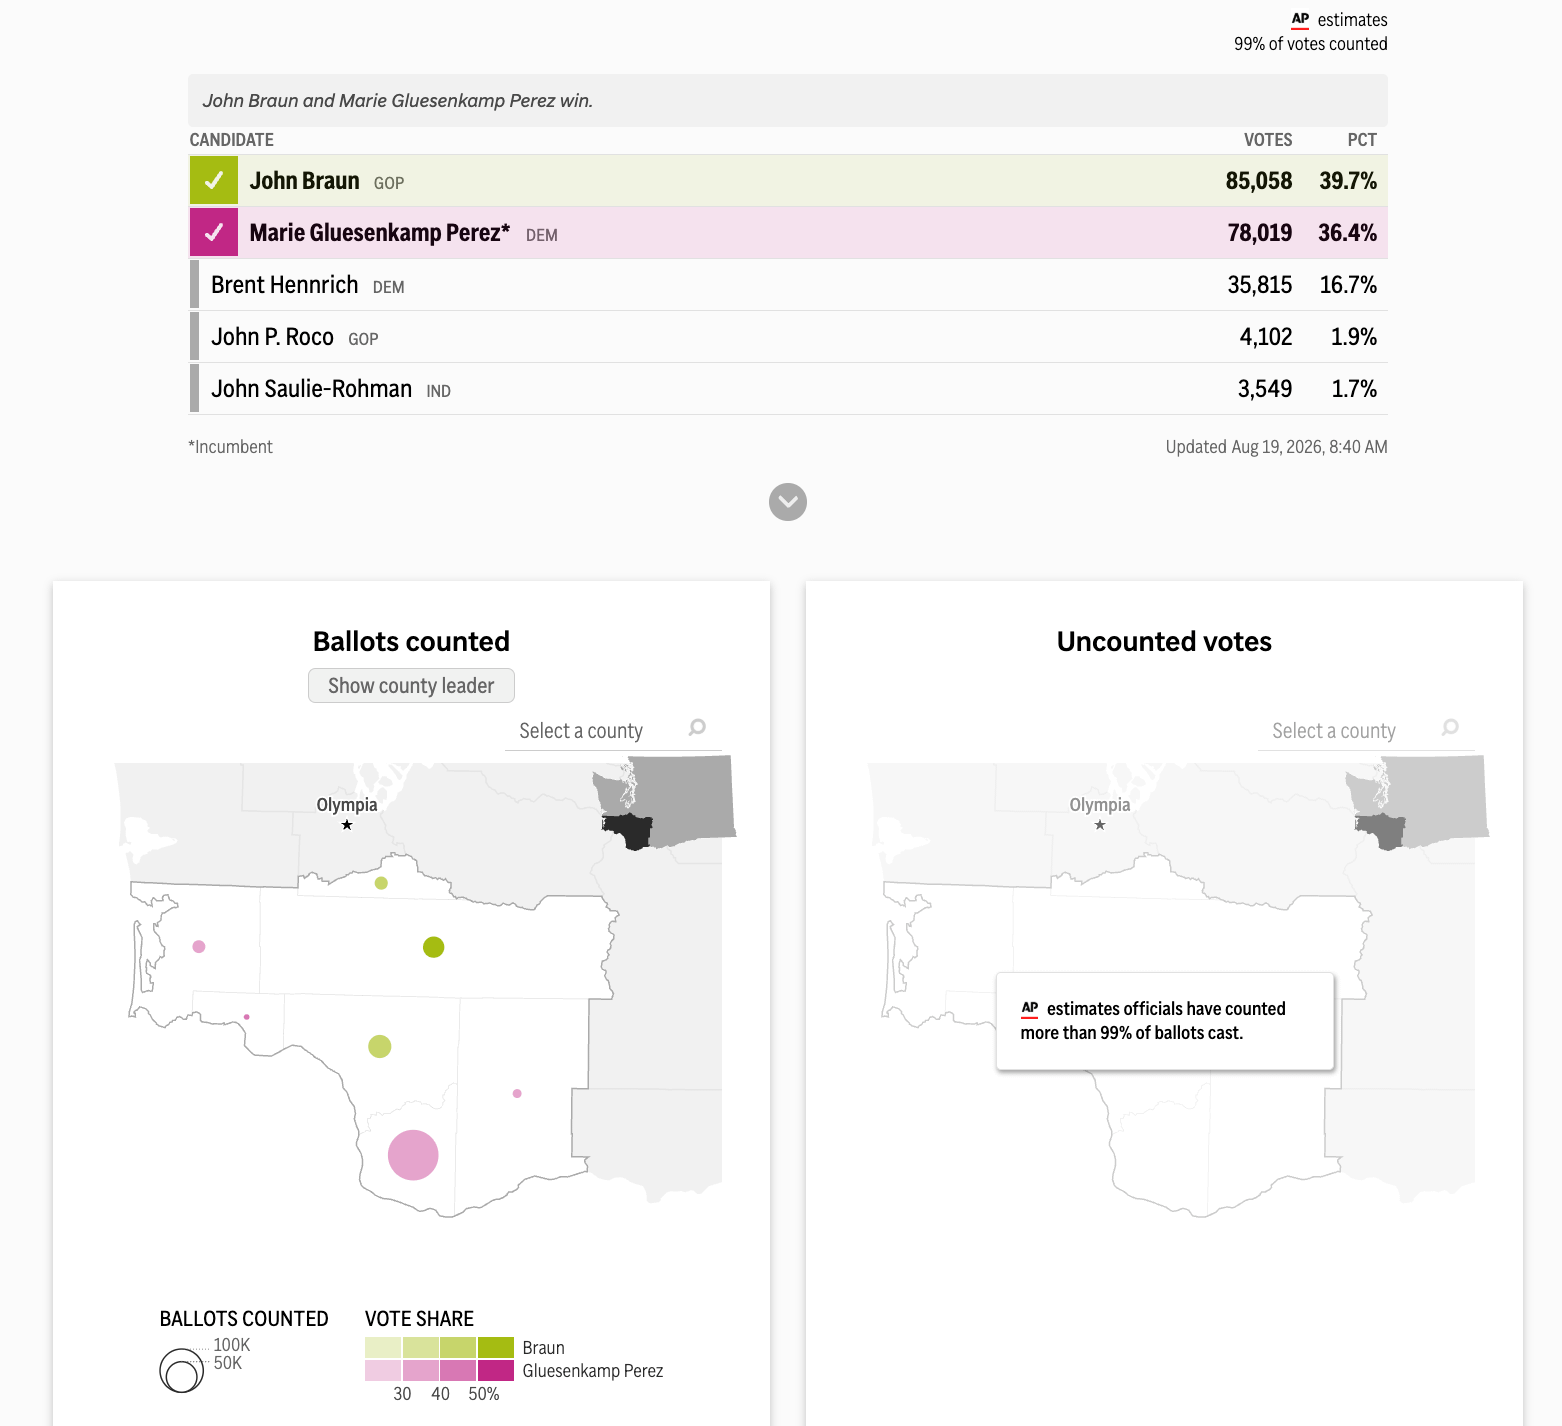
In 2022, moderate incumbent Democrat Marie Gluesenkamp Perez narrowly defeated Republican Joe Kent after Kent unseated Jamie Herrera Beutler from the right. In 2024, she defeated Kent by almost four points, despite Trump winning the district by 3 points.
This year, Kent did not go for another rematch. Republican John Braun, who is more moderate than Joe Kent and who was the minority leader of the Washington state senate, gained the backing of the GOP establishment.
Both Braun and MGP made it into the general election, with MGP fending off a strong primary challenger in Brent Hennrich, who was backed by local progressive groups. Democrats are combining to over 12% more than the Republicans, and MGP is outright winning Trump+11 Skamania County and Trump+19 Wahkiakum County. It’s hard to see most of Hennrich’s voters not voting for Perez in the general election. (It’s also hard to see many Republicans voting strategically in the primary given Trump’s backing of Braun.) Without something drastic, Perez will likely coast to reelection.
Something that Ethan C7 noticed when he was analyzing the primary results is that the two counties where Democrats did relatively worse in the district were Lewis County and Pacific County. These counties lie outside the Vancouver media market, so some of MGP’s strength likely comes from advertising.
Washington’s 5th District
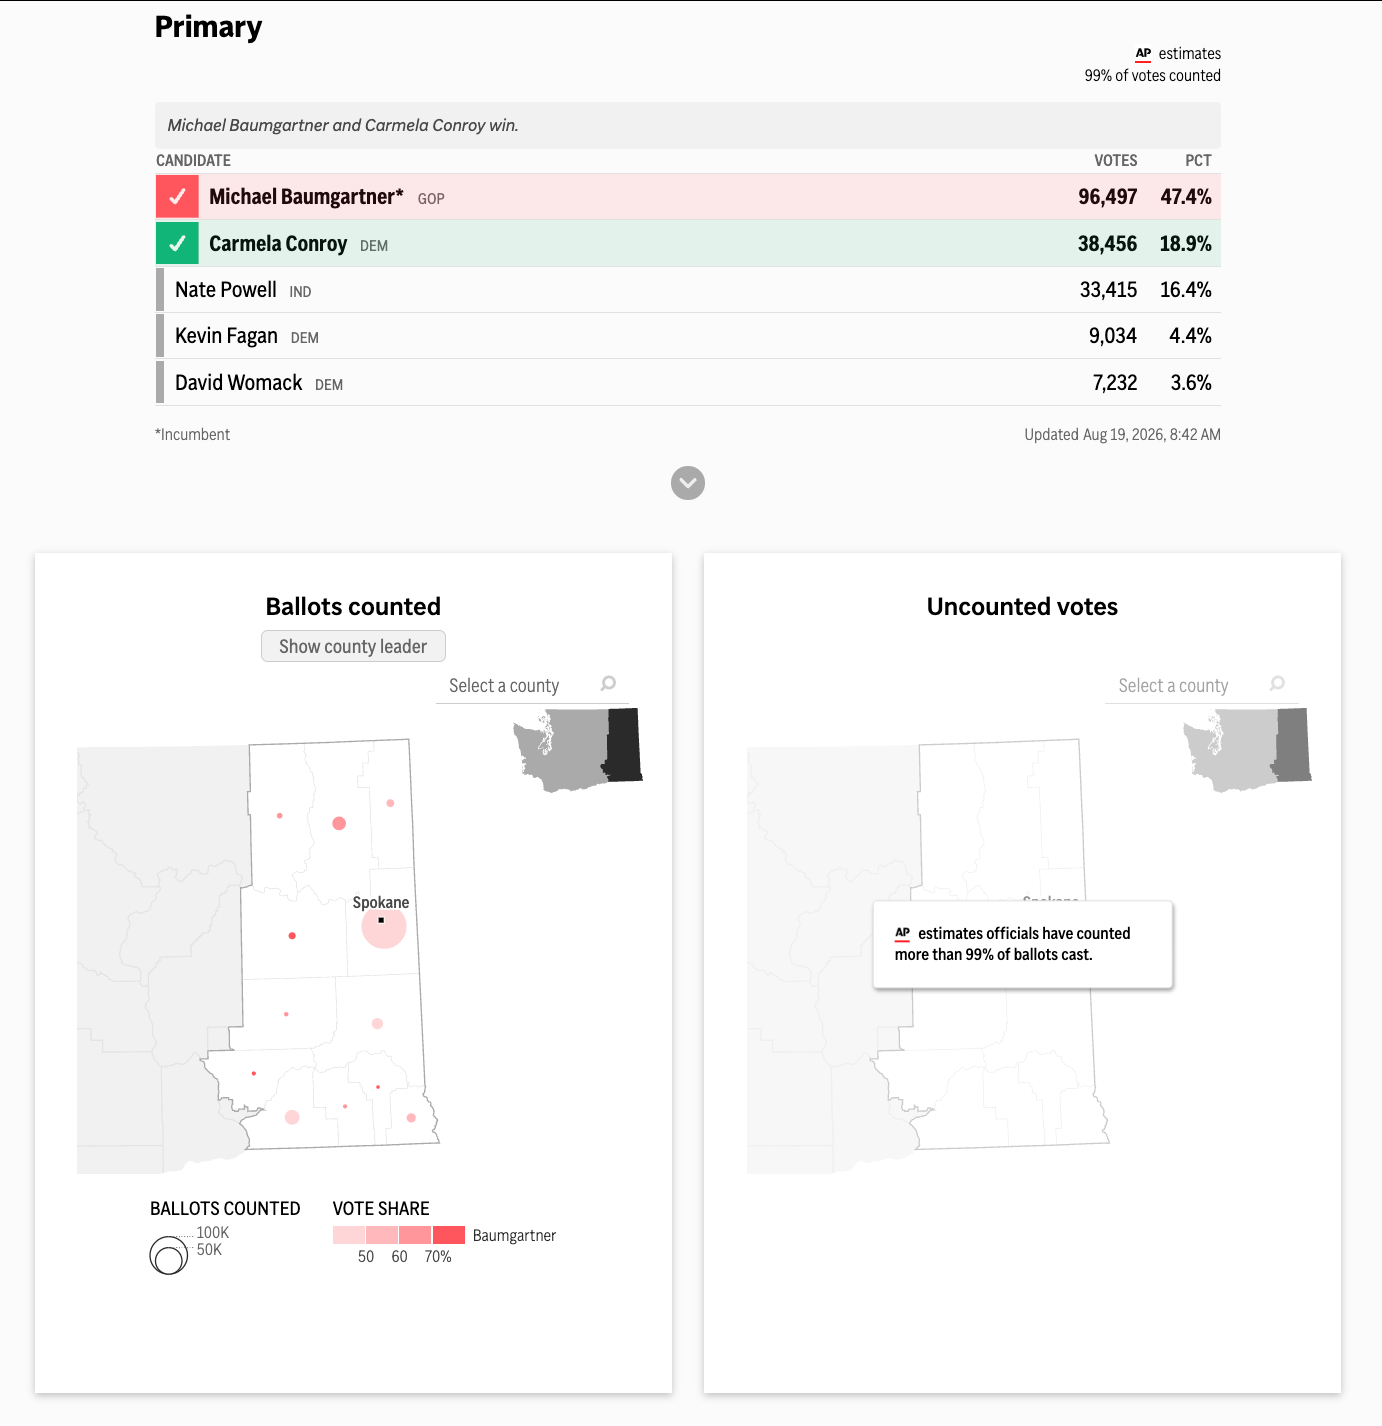
In 2024, Michael Baumgartner won WA-05 by a commanding 20-point margin, far exceeding Trump’s 11-point margin in the district. Most people did not expect the district to be especially competitive this year, and most election handicappers rated the district as Safe R.
This year, Baumgartner was the lone Republican running against a field of Democrats and Independents. On the non-Republican end, the field coalesced around two candidates.
Nate Powell, a veteran and union firefighter, gained the backing of groups like the ones backing Dan Osborn. He takes generally left-populist policy positions, supporting Medicare for All, campaign finance reform, and increasing border security while improving legal pathways to citizenship.
Carmela Conroy was a diplomat for 25 years before she ran for this seat two years ago. Her policy platform is similar to Powell’s in terms of immigration and anti-corruption reform, but is more moderate on healthcare.
Conroy will advance to the general election. Given her loss in 2024, her work is cut out for her. However, given that Baumgartner’s vote share is under 48 percent and that Democrats (and Nate Powell) combine to more than Baumgartner’s vote share, there is a path to victory.
One caveat for this district’s results is that much of the district was on fire in the days preceding the primary election. The fires heavily affected some communities there; thousands of people were evacuated from their homes. It will be difficult to determine the effect the fires had on voting, but they likely depressed turnout. Given that the pro-Democratic shifts in the southern part of the district are similar to the north, however, I don’t believe the fires meaningfully changed this result enough to change the district’s electoral assessment.
Implications for the 2026 Midterms
We can attempt to extrapolate these results to the national environment without reference to other indicators. The standard deviation for this approach is approximately 4.5% (with around half of the variance coming from Washington potentially trending differently from the rest of the nation). The toplines from the other metrics you could use for extrapolation are shown below, and I would recommend leaning towards lumping Sawant and Powell to the Dem total for the aforementioned reasons.
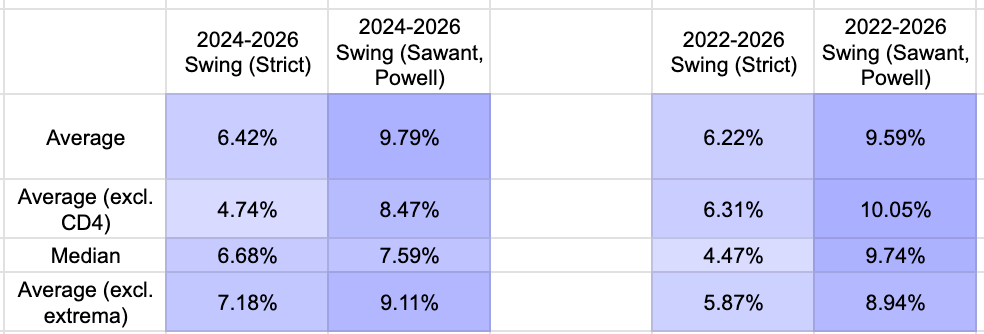
These values suggest a blue wave. The 2018 and 2006 generic congressional ballots were D+8.6 and D+8, respectively, and they both seem to fit these estimates quite well (especially given that there is more reason to lump Sawant and Powell with Dems than not)
That said, there are a number of ways this “““forecast””” can be off in both directions; a normal error in either direction would imply either a close House of Representatives contest or a Democratic blowout in both chambers.
Reasons the national environment could be redder than the primary suggests
Midterm Turnout
Democrats could be turning out at higher rates for primaries, which could cause the primary to “overshoot” their margin a little bit. In the three midterm wave elections which had the primary (2010, 2014, 2018), the primary overshot the out-of-power party’s margins in Washington. (To be fair, this did not happen in the presidential wave election of 2008.) With Democrats turning out in high numbers in primaries, there is good reason to believe this will happen in 2026 as well.
Of course, Democrats would rather see greater party enthusiasm than not. However, this does tend to manifest in stronger ways in primary elections than general elections.
Splintered Primary Fields
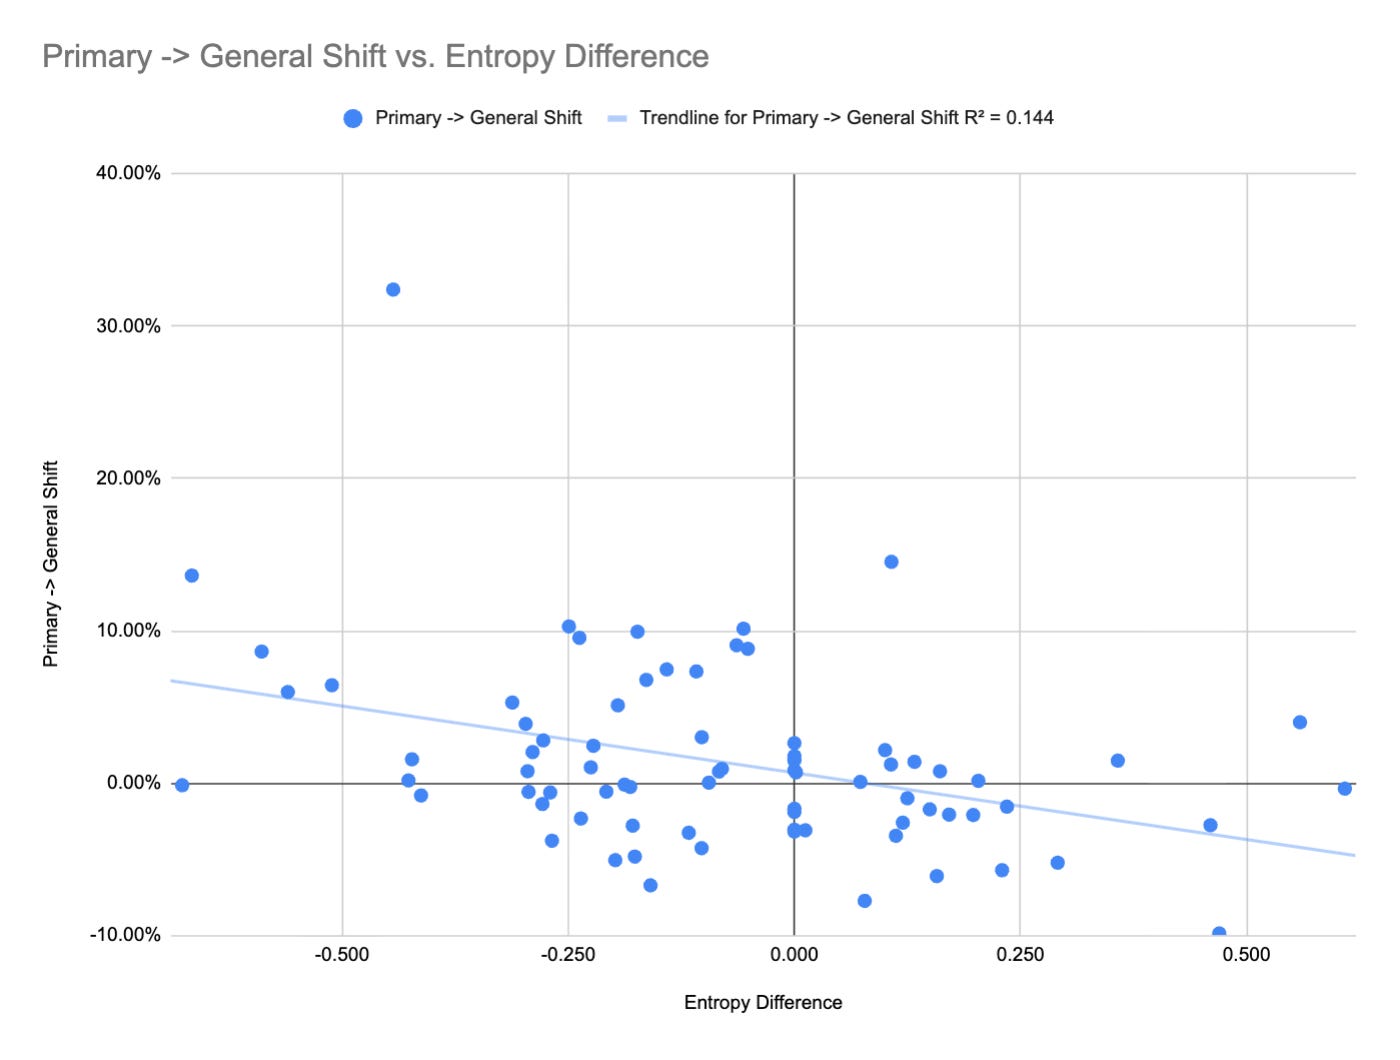
Democrats, on average, had more splintered fields than Republicans. For each primary since 2008, I measured the difference in field splintering and plotted it against the primary-to-general shift. It seems clear that increased vote splitting by a party tends to create a slight mirage in the primary margin.
There are a few ways this can manifest:
- Vote splintering can signal a competitive intra-party battle for a primary slot, leading to more turnout for that party and, in some cases, crossover voters who try to bail out the more “acceptable” candidate. The most notable examples are the aforementioned WA-04 primaries and the 2022 WA-03 primary.
- Vote splintering can also result from voters signaling frustration with the frontrunner (and usually an incumbent). These voters will not necessarily vote for their primary’s frontrunner in November, although many do.
- Different candidates from the same party can have different policy positions that attract different voters. This may attract broader combined support than just the person who advances.
Using this regression, we can “adjust” the Congressional topline estimates roughly 0.8% in favor of the Republicans. I would caution against doing this while doing a wave correction because many midterms have competitive primaries for the out-of-power party.
Reasons the national environment could be bluer than the primary suggests
The Washington Primary Electorate
As mentioned in the beginning of the article, Democrats are expected to do better in areas with minority voters and people without a college degree. Since Washington is whiter and more college-educated than the nation at large, the state may swing less than the nation as a whole. This is similar to 2024, where Washington (relative to 2020) trended left relative to the nation as a whole relative to 2020. Washington also trended to the left of the nation in 2022. Thus, comparing 2022 to 2024 would have given a GCB estimate of ~R+1. Young voters and disengaged voters are also expected to swing left more than the nation, while they make up a disproportionately small portion of the Washington Primary electorate.
Other Unknowns
Three Months to Election Day
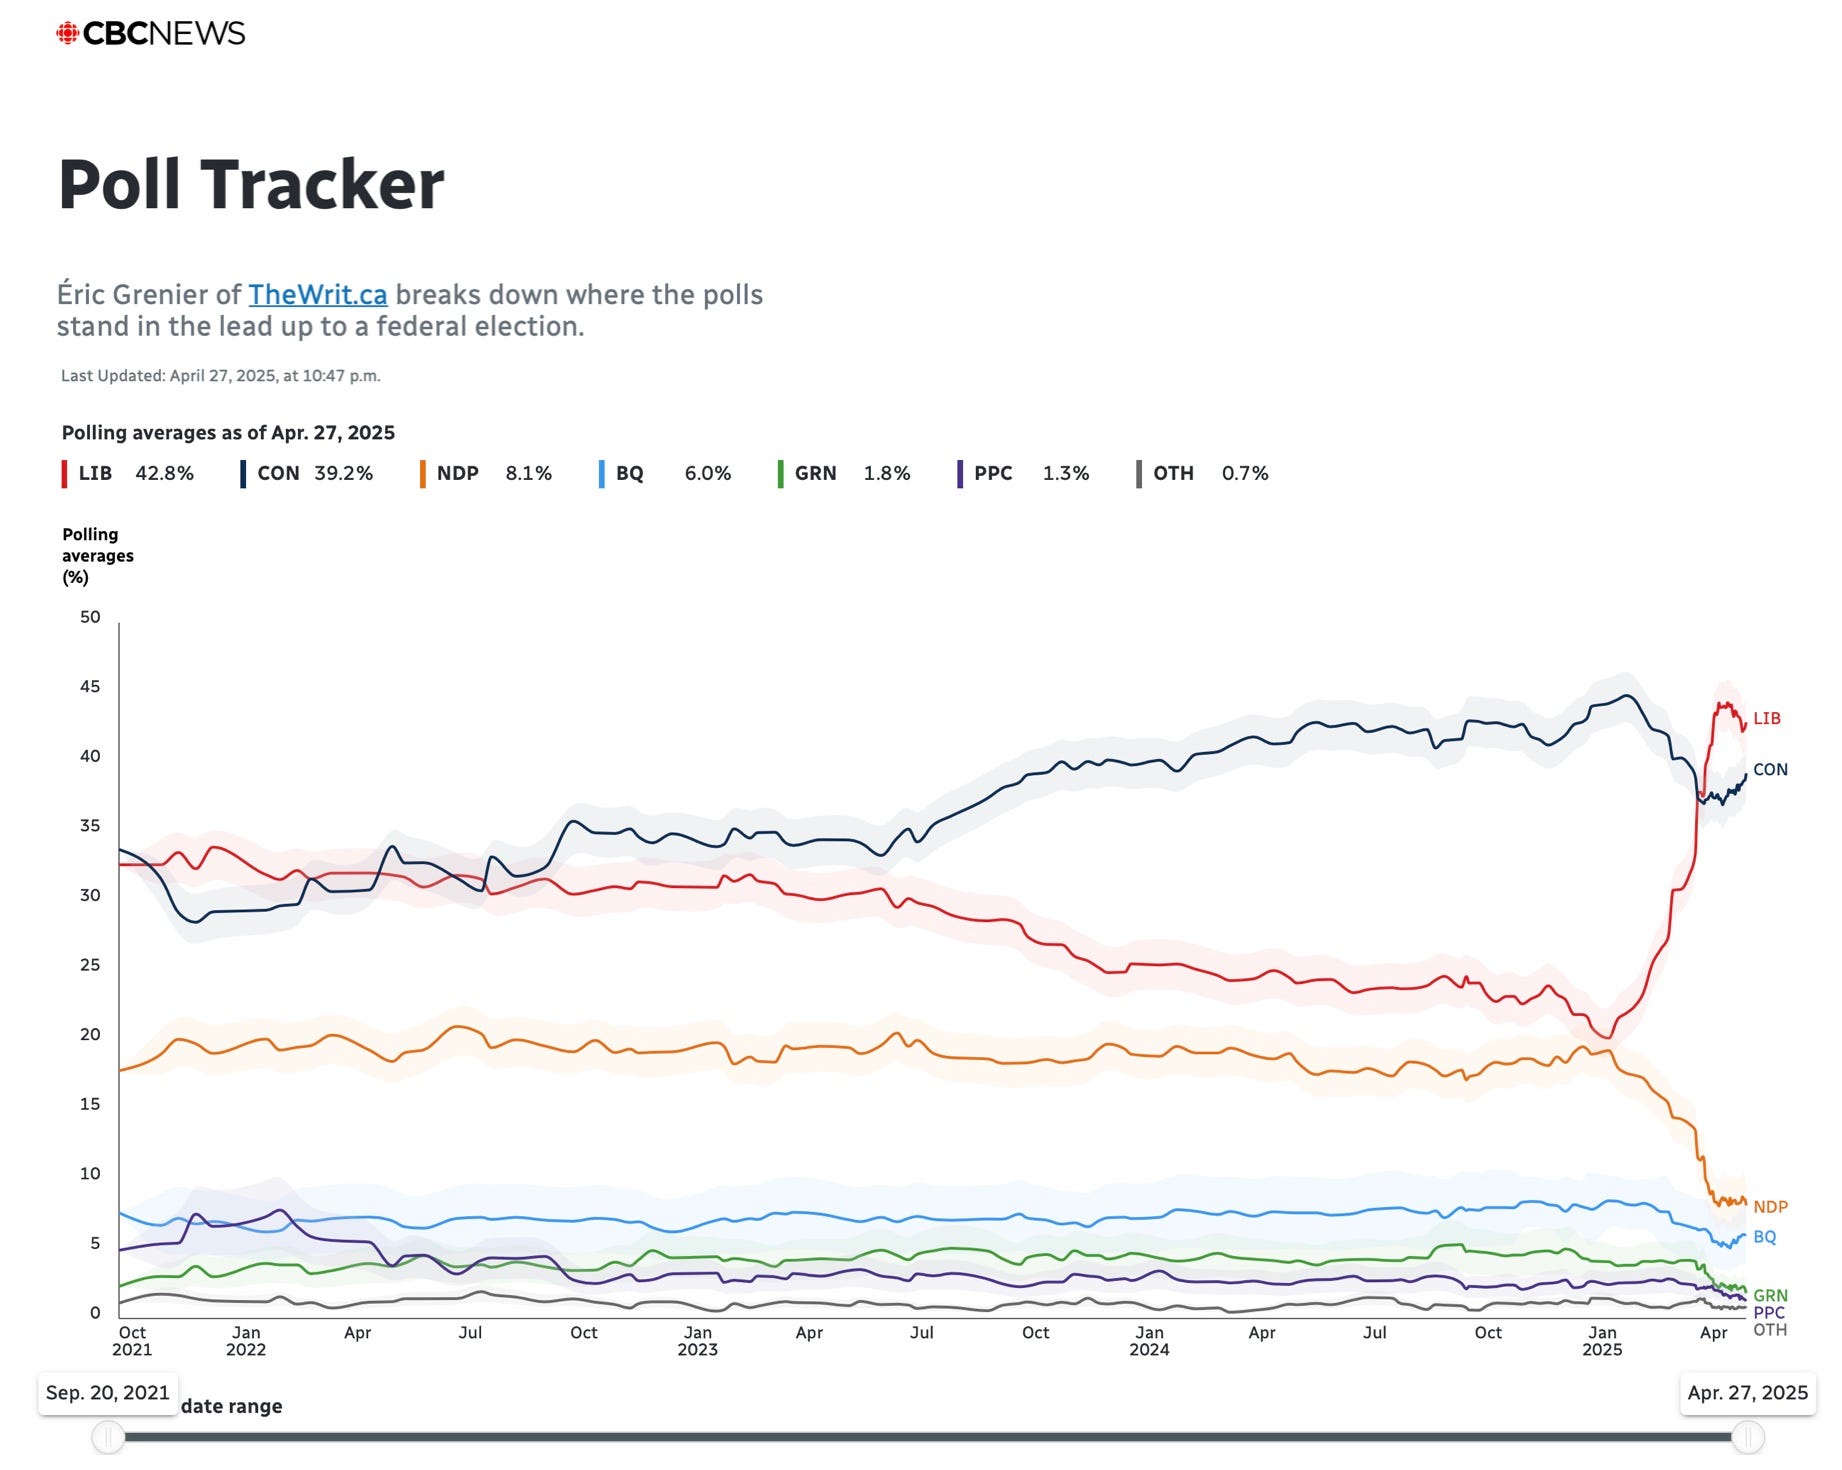
Of course, the Washington Primary exists as a snapshot three months before Election Day. Especially in the Trump era, the future is very unpredictable. Gas prices could return to normal during this period, or they could keep rising! Major events and “October Surprises” can change the political environment in a dime. A great example of this phenomenon was in the 2025 Canadian election. Of course, polarization makes movement of this magnitude unreasonable in the United States. But big changes can still happen.
Campaigns
Political campaigns (obviously) matter a lot! The Washington Primary can try to predict the political baseline before the election, but television advertisements and door-knocking can change the trajectory in close races. It is not a full forecast for individual races, and thus for chamber control as a whole. In 2022, Democrats wouldn’t have won the Senate without their candidate quality advantage. The Primary does us no favors in predicting candidate quality for 2026.
Conclusions
The Washington Primary represents more confirmation of earlier indicators (polls, the 2025 cycle, special elections, etc.) that show a blue wave environment. The Washington Primary is arguably the strongest indicator for Democrats in this respect.
Still, we should try not to put too much trust in the primary. We can’t assume that it will over/understate Democrats; I have provided many reasons why it can do both. The Primary should open up the possibility that Democrats are holding stronger with suburban voters than expected, but this could also be localized. We just don’t know.
If you already believe that November will be a blue wave, I hope that this discussion highlights some of the uncertainties inherent in these indicators. High voter enthusiasm can cause some of these indicators’ misses to correlate. As we’ve seen in some primaries, partisans should try to calibrate our expectations well. Our brains are generally bad at internalizing probability. As Lakshya Jain says, “weird shit happens.” The Washington Primary doesn’t change this maxim.
If you are a Republican and believe that a large blue wave is impossible, I hope you come away from this article acknowledging the possibility of a blue wave — even one that’s somewhat larger than what indicators are predicting. I think this tweet sums up my thoughts on this subject pretty well.
- To be fair, Alaska has not had the top-four primary for very long. Perhaps over time, as parties adapt to the unique race dynamics involved, it will prove to be more predictive. I doubt this though, simply due to the turnout dynamics of Alaska Natives. ↩︎
About the Author