

In the leadup to the 2026 midterms, more and more polling is coming out showing that Democrats are not just set for a blue wave, but potentially a blue tsunami. However, I noticed a concerning trend couple of these extremely rosy polls for Democrats.
There are generally three types of samples in polls: Adults (A), Registered Voters (RV), and Likely Voters (LV). While the first two are pretty self-explanatory and are usually interpreted the same in polling, LVs are not. Some pollsters have a rather narrow definition of what a likely voter is, and some have a more nuanced definition. It was with the former interpretation of a likely voter that exposed a flaw, one that inadvertently was showing Democrats to have a bigger lead than advertised.
The main poll we’re going to look at today is the Economist/YouGov poll taken from September 25th-28th. YouGov found a very stark difference between their registered voter numbers, and likely voter numbers on the Generic Ballot:
Registered Voters: Dem: 45%, Rep: 37% (D+8)
Likely Voters: Dem: 53%, Rep: 38% (D+15)
This has also been a pretty consistent trend for this weekly poll since they switched to RV/LV after Labor Day (they were using A/RV). The way they decide who is a likely voter, however, is rather narrow. It only includes people who either have voted or definitely will vote. In the “likelihood to vote” question, YouGov/Economist gave respondents seven different answers, including “don’t know” and “already voted” (likely early or absentee). Yet despite giving these choices, they did not include ANYONE who says they “probably” will vote.
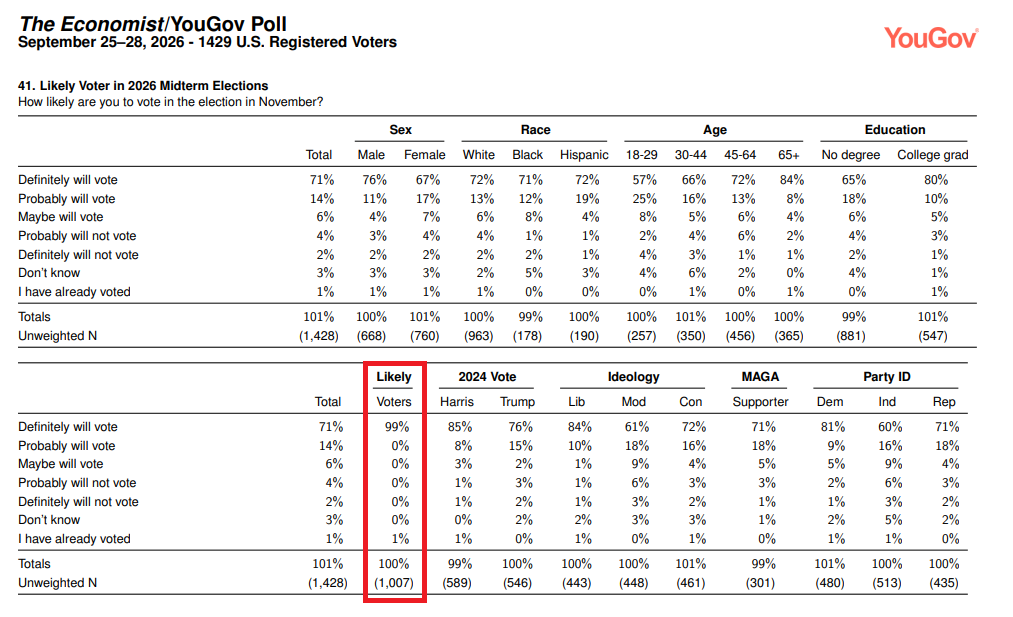
If someone says to you, “I will probably vote”, you would expect them to vote most of the time! At the very least, YouGov/Economist should have either included everyone from “probably will vote” or weighted so that, effectively, some of the respondents in that sample would count. At first, you may think this isn’t a huge deal, as it only cuts out around 200 people. But the problem arises when we look at the composition of these probable voters. They clearly are Republican leaning, and voted for Trump in 2024. 21% are Democrats, 40% are Independents, and 38% are Republicans. Additionally, out of those who voted in 2024, 36% were Harris voters and 64% were Trump voters.
There’s ample evidence that if the “maybe will vote” respondents voted, they would lean Republican, as evidenced by the difference from the Registered Voters and Likely Voters split. “Probably will vote” respondents also make up the plurality of everyone left in the sample.I think we can safely say that the D+15 Likely Voter result is, at the very least, misleading.
This isn’t unique to YouGov/Economist, as Marquette Poll’s poll from 9/2-9/9 only included people who say they are “absolutely certain” and also saw a big difference between the likely voter (D+13) screen and the registered voter screen (D+8), suggesting the people that said they are “very likely” to vote and others below that lean Trump/Republican.
Let’s compare this to a poll done by Siena College/New York Times earlier in the month, from 9/8-13. They use a likely voter screen that weighs 1/5th based on the “how likely are you to vote” question, and 4/5ths on a modeled turnout score, based on factors like Party ID, demographics, and previous voting habits.
From their methodology: “Four-fifths of the final probability that a registrant would vote in the 2026 election was based on the registrant’s ex ante modeled turnout score, and one-fifth was based on self-reported intentions, based on prior Times/Siena polls, including a penalty to account for the tendency of survey respondents to turn out at higher rates than nonrespondents.”
So, when they asked the question of how likely respondents were to vote, their results looked much different from the Economist/YouGov poll:
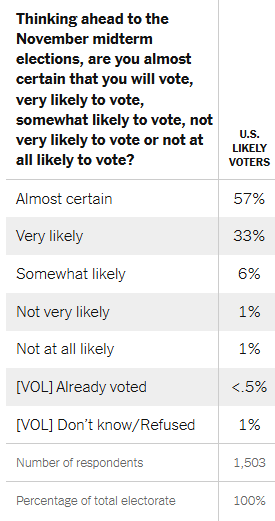
What’s most interesting is that there is no real difference between their registered voter and likely voter Generic Ballot question, with Dems leading by 7% in the registered voter poll and by 8% in the likely voter poll. A pollster actually tested the difference between these two screens, with G. Elliot Morris’ recent poll for Strength in Numbers (9/16-21) having both forms of the “likely voter” screen. As a baseline, all of the registered voters in the poll said they preferred Democrats by 8%. Out of those who just said they definitely will vote, Dems are winning by 12%, but using a likely voter screen, Dems are only winning by 10%.
What does this all mean? The difference between Democrats winning by 8% or 15% is substantial. The former implies a 2018-sized blue wave where Democrats are competitive in the Senate, and the latter implies that Democrats win north of 270 House seats and 55 Senate seats. Democrats are very motivated to say they are voting, while Republicans are not. However, if you simply exclude those less-enthusiastic Republicans from polls, you may end up getting a sample that’s too Democratic. At the end of the day, all pollsters have some flaws with their methodology, and the best thing to do is, as we say, to throw it into the average.
About the Author