NOTE: We do not endorse nor condone gambling or prediction markets, the purpose of this article is to educate and inform about the validity and accuracy of the odds you see on there. Do your research before joining prediction markets.
Have you been scrolling social media, and seen a post like this?
Chances are you have, especially in and around election spaces. Prediction markets, such as Kalshi and Polymarket, have recently risen in popularity, being an alternative to traditional “gambling” such as sports betting. Although primarily used for placing wagers on sports (nearly a billion dollars was bet on during the Super Bowl alone on Kalshi), they have odds for… just about everything, including politics. Some people don’t bet, but still take the odds seriously, and use them as an indicator for how elections may go. So we wanted to figure out, how accurate are prediction markets for predicting elections? For this article, we will be using Kalshi, the best known prediction market, as the primary source, but will also be mentioning Polymarket at times.
Kalshi was founded in 2018, then known as Kownig, but has rapidly gained popularity since 2024. Since then, it’s partnered with everyone from VoteHub to CNN, providing live odds to their website and news coverage. It’s gotten into some hot water, because it sure seems a lot like gambling, which isn’t legal in every state. It’s not technically “gambling” because users trade against each other, not a house. If you put a bet on say, Democrats winning the House in 2026, you’re basically betting against someone who picked the Republicans to win the House, not Kalshi itself. You can also sell your stocks early, if what you bet on has raised in odds. For example, if you put a bet on the Democrats winning the House when they had 50-50 odds, and it’s risen to a 75% chance they win the House, you can sell early and get a profit. Think of it like options trading for stock markets, just for other stuff. Directly from their website:
At the core of Kalshi’s pricing system is the concept of market-assigned probability. The platform continuously assesses the collective sentiment of its users regarding the likelihood of an event resulting in a “Yes” or “No” outcome. This probability is expressed as a percentage, ranging from 0% (certain to not happen) to 100% (certain to happen).
The contract price for a particular event is directly tied to this probability. As the perceived likelihood of a “Yes” outcome increases, the contract price for “Yes” will rise, while the contract price for “No” will correspondingly decrease. Conversely, if the market believes a “No” outcome is more probable, the contract price for “No” will increase, and the contract price for “Yes” will fall.
So yea, it’s not treated as gambling by the government, although other countries, and even the US, have taken steps to try to regulate sites like Kalshi and Polymarket. But, they still persist, and are here for the long haul.
Because of that, we wanted to take a look to see how accurate they are, as a tool to predict the results of elections. We took 5 elections from within the past year, and are going to look to see if prediction markets are truly… predictive. We also are making one major assumption: if a candidate had very high odds to win per Kalshi’s odds, we are going to assume that people betting thought they would also win by a decisive margin.
Past Elections
Texas Democratic Senate Primary:
Actual Result: Talarico +6.4
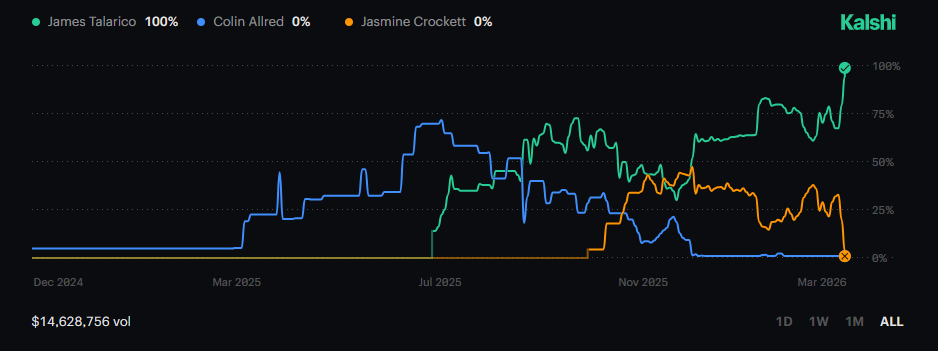
At Poll Closing
James Talarico: 94.8%
Jasmine Crockett: 3.7%
1 Month Before:
James Talarico: 76.2%
Jasmine Crockett: 21.7%
3 Months Before:
Jasmine Crockett: 43.9%
James Talarico: 38.6%
Colin Allred: 10.6% (He dropped out 5 days later)
Given that Talarico only won by 6%, the 95% odds of him winning at poll closing were quite bullish. One thing that is quite clear about prediction markets just by looking at any event is that the market can be very volatile, and jump wildly based on events that happen. Talarico’s odds of winning jumped by 14% after the Colbert interview, and spiked at the end based on a string of good polls. Kalshi’s odds had Crockett favored 3 months ago, but that was also before Allred dropped out, which seemed to push Talarico permanently into favored territory. One other thing to note is that just because Kalshi was “wrong” 3 months before the election, doesn’t mean they were wrong then. In our opinion, it’s very possible that if the election were being held in late December, that Crockett would have won! But as this is just speculation, we don’t know for certain. The 2 polls that were done in December both had Crockett winning, but that’s just not enough of a sample size to make any conclusions. Our Discord was pretty split, and one noted user had Crockett winning by 6% a couple days before the election.
Overall, by election day, did the evidence point to Talarico having a better chance of winning? Yes, but a 95% chance of winning? Likely not.
Grade: B-
Virginia Governor:
Actual Result: Spanberger +15.4
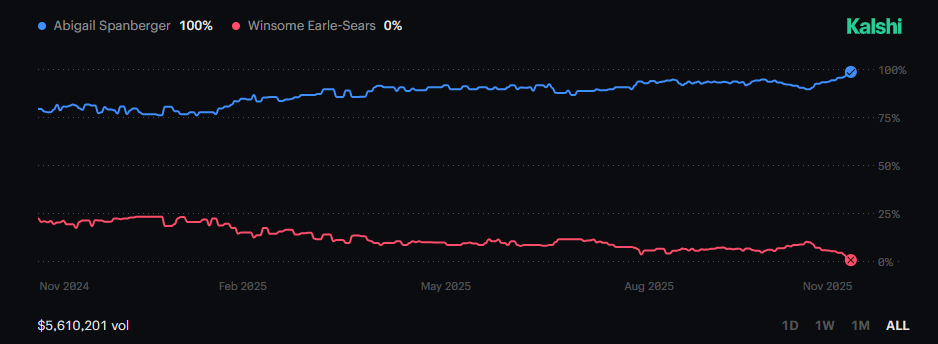
At Poll Closing
Abigail Spanberger: 98%
Winsome Earle-Sears: 2.4%
1 Month Before:
Abigail Spanberger: 94.5%
Winsome Earle-Sears: 5.8%
3 Months Before:
Abigail Spanberger: 94%
Winsome Earle-Sears: 6.7%
There’s not much that needs to be said about this race. Very few polls had Earle-Sears ahead, and Spanberger ended up winning by 15%. Kalshi, the public opinion, and polling all lined up, and all were right.
Grade: A
Virginia Attorney General:
Actual Result: Jones +6.7
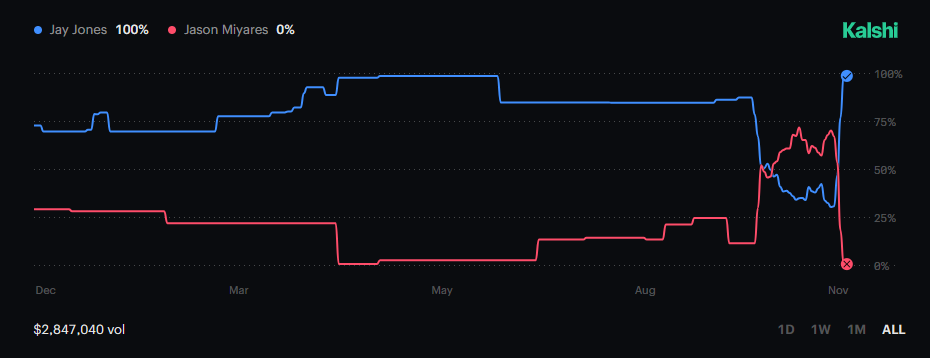
At Poll Closing:
Jay Jones: 77.1%
Jason Miyares: 18.9%
1 Day Before:
Jason Miyares: 54.6%
Jay Jones: 47.3%
1 Month Before:
Jason Miyares: 54.3%
Jay Jones: 51.9%
3 Months Before:
Jay Jones: 85.2%
Jason Miyares: 15%
The Virginia AG race is a pretty unique one, because 3 months prior to the election, it wasn’t talked about at all, and probably would have stayed that way… if not for a texting scandal uncovered in early October. Jay Jones, the Democratic nominee, made some unsavory comments in texts in 2022 about Republican members of the House of Delegates, and received bipartisan condemnation because of it. Because of this, a lot of people, Kalshi users included, thought this race could be an opportunity for Republicans. One month before the election, and even a day before the election, Kalshi’s odds had Miyares, the Republican incumbent, favored to win. That did not end up happening, although Jones underperformed Spanberger significantly. Funnily enough though, Jones actually did better than Harris did in 2024 against President Trump.
This race is one good reminder that Kalshi’s odds tend to react more than act. Most polls showed Miyares winning, even in the days leading up to the election, and the Kalshi odds reflected that. It doesn’t seem that Kalshi users know stuff that the general public doesn’t, but that’s for the best anyways. One other thing to keep in mind when looking at odds is that elections are fundamentally connected. If Spanberger didn’t do better than expected at the top of the ticket, Jones would have probably lost.
The only reason we aren’t giving this a negative grade is because the odds were technically correct at poll closing, and this was seen as an upset in the first place.
Grade: C
New Jersey Governor:
Actual Result: Sherrill +14.4
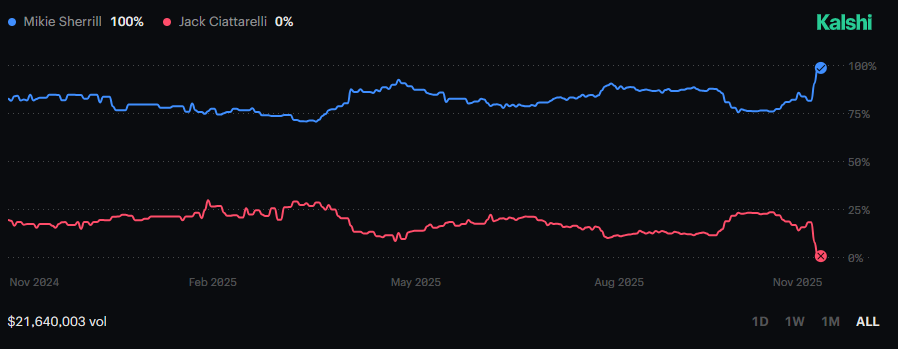
At Poll Closing:
Mikie Sherrill: 91%
Jack Ciattarelli: 8.3%
1 Month Before:
Mikie Sherrill: 77%
Jack Ciattarelli: 23.6%
3 Months Before:
Mikie Sherrill: 90.9%
Jack Ciattarelli: 11%
Republicans thought they could potentially upset the Democrats in this race, for a few reasons. The incumbent, Phil Murphy, was seen as unpopular, Ciatteralli did pretty well in the last governor’s race in 2021, and New Jersey had one of the biggest rightward shifts from 2020 to 2024. There were a few polls that had Ciatteralli within the margin of error, so there were expectations among some groups that this race could be close.
That being said, other polls showed this race not being super close, and other communities, including our own Discord, thought Sherill would win fairly easily, which she did. Sherill was consistently the favorite on Kalshi, and had above a 75% chance to win nearly the whole time. The only thing we’d take away from Kalshi’s odds is that Ciatterelli did have a 20% chance to win at times, which is quite generous considering Sherill won with a 14% margin..
Grade: A-
NYC Dem Primary for Mayor:
Actual Result: Mamdani +12.8% (Final Round)
At Poll Closing:
Zohran Mamdani: 78.8%
Andrew Cuomo: 20.5%
1 Month Before:
Andrew Cuomo: 90.8%
Zohran Mamdani: 7.2%
3 Months Before:
Andrew Cuomo: 75.1%
Zohran Mamdani: 9.1%
Out of all the elections we looked at, this is probably the least accurate one. Cuomo was seen as the favorite when he entered, and it stayed that way for most of the election. There is one consideration to make though, the fact that the Democratic Primary was Ranked Choice Voting. Now, this is a side tangent, but you may hear that Republicans don’t like RCV because of this election, but we would point out that it was Cuomo’s fault if anything. There were so many candidates, and pretty much everyone else crossendorsed with each other, in order to take down Cuomo.
Anyways, Mamdani ended up winning even without the RCV calculations, as he had Cuomo beat in the first round. Kalshi’s odds had Cuomo had pretty much the whole time, not flipping to Mamdani until the last day. While the odds for the Virginia AG’s were mostly incorrect, something fundamentally changed in that race that could make it competitive. Nothing like that happened, and it seems like Cuomo would have lost if, say, Lander was the candidate the other candidates coalesced around. The only reason we can see that Cuomo was ahead on Kalshi’s odds, was that a lot of polls said Cuomo was ahead. While understandable, it doesn’t exactly give us confidence that it can be used as a completely independent indicator for elections.
Grade: D+
Conclusions:
The biggest conclusion from our research into their odds and the process, is that Kalshi can’t even be credited/trashed for being accurate/inaccurate, because they don’t manually adjust odds, it’s all done based on how people bet. Essentially, they are trying to quantify public opinion, so their odds aren’t that different from say, scrolling on Election Twitter for 20 minutes and tallying up what people think is going to happen in an election. Because of that, it’s about as accurate as the general population is, and also doesn’t deviate considerably from polls. It’s perfectly fine as a tool for that, but you shouldn’t make decisions about how an election will go based on that. If you really want to know, you should do the research and dig into how people may have come to their own conclusions, based on polling, demographics, and much more.
All Screenshots were taken from Kalshi.com