
Note: All Early Voting Info is from 10/27 and before.
As early voting continues in Virginia–and election day nears–some interesting trends have emerged since early voting began. Demographically speaking, there’s good and bad news for both campaigns, and by using our 100k District project, we’ve found some interesting trendlines throughout the state that could shed light on what the final result might look like.
Northern Virginia (NoVa)
We’ll start by analyzing three counties in the Northeast of the state, Loudoun, Fairfax, and Prince William, which are part of the “NoVA” region, which holds about a third of the state’s population and is heavily democratic. A Spanberger victory (or landslide) relies on turning out these Democratic voters, but right now, these areas are turning out at a lesser rate than the state overall. Why?
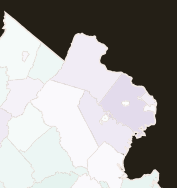
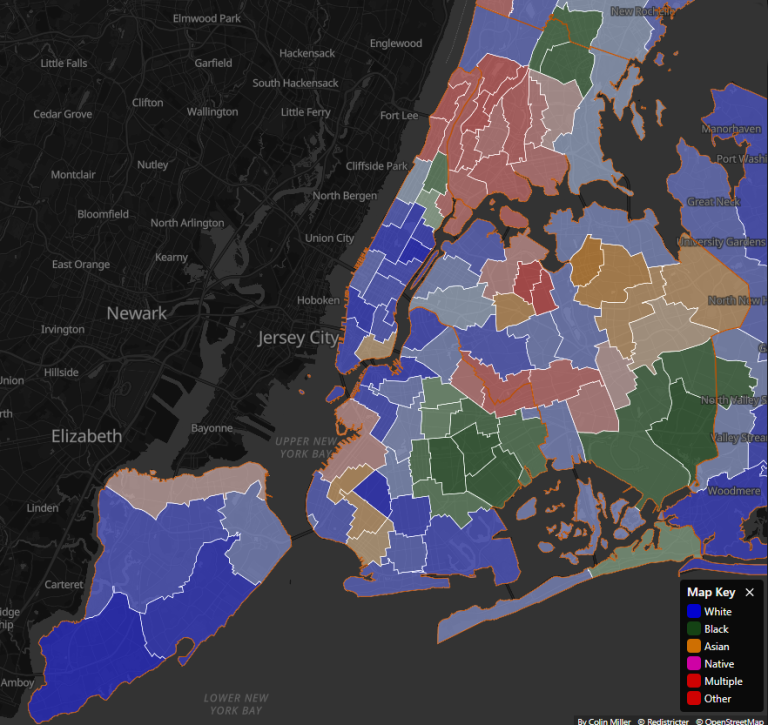
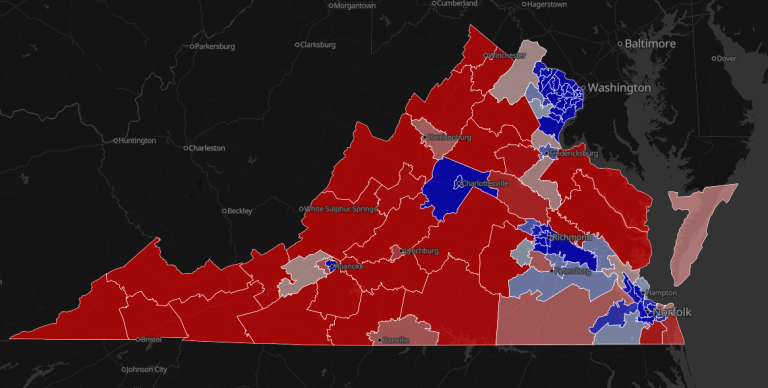
All early voting data is via the great people at State Navigate. The deeper purple, the worse the county’s turnout compared to the state, while a deeper green means vice versa. To start, we’ll break down Loudoun County first, which is currently lagging behind the state in turnout. But to get a better understanding as to why the gap in turnout is so significant, let’s shift to a precinct-level viewing and overlay the 100k districts over it to get a better understanding of the demographics and classification of the different parts of the county.
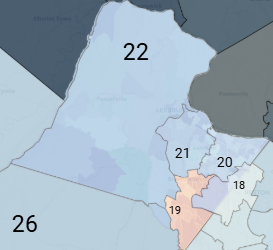
VA-19 has the weakest turnout in the county, and breaking down the district demographically, Asians are the largest ethnicity at 42% (colored in orange), while whites trail at 37%. It’s also considered educated and urban. The next weakest district in turnout is VA-21, which is an extremely white district (at nearly 60%), with the second-largest ethnicity being Asians at around 20%. Interestingly, though, it isn’t considered urban, but rather educated suburban. VA-20 is where turnout finally matches that of the county overall, and this district has substantially less of an Asian population than the two discussed above, while it bolsters a large white (50%) and Latino (20%) population. It also happens to be educated and urban like VA-19. The last district is VA-22, which is the only Republican district of the county, and has a very large white population (71%) and is doing better turnout-wise than the county overall. It’s considered an educated rural district.
Given the data, there seem to be a few interesting trends that could be extrapolated:
- The whiter the district, the higher the turnout
- Asian voters don’t seem to be turning out
- Suburban turnout may be lagging
- Latino voters are turning out (?)
But before we make any immediate assertions, let’s explore the rest of the NoVA region to see if these statements hold. Let’s jump to Fairfax next, which has a massive population and is quite diverse.
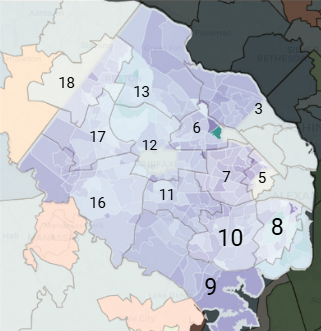
Since there are a ton of districts, I won’t go through each one by one, but rather point out noticeable trends. Most of the districts are urban, so let’s first take a look at the few suburban districts, which are 9, 13, and 16. They happen to have some of the deepest purple areas (specifically 9), which seems to bring validity to the assertion that suburban voters aren’t turning out much, but what does the ethnicity of these districts tell us? Well, VA-16 is the most diverse, as it is a plurality white district (49.9%), where Asians make up the second-largest ethnicity (26%). Looking even closer, the deepest purple areas are on the west side of the district, which happens to boast a large Asian population. Jumping down to VA-9, ethnicity doesn’t seem to give many clues, as the district is very white (61%), while the rest of the demographic layout is spread out nearly evenly between Latinos, Asians, and blacks. If you add up both the Asian and black population of the district, though, it comes out to about a quarter, which could explain the weak turnout. VA-13 is even more white (64%), but it also boasts a sizable amount of Asian (16%) and black (10%) voters, which seems to bring validity to the argument that Asian and black voters aren’t turning out. Overall, it seems that these suburban districts seem to confirm our priors about Asian voters and suburbanites, while also shining light on another possible issue for the Spanberger campaign: low black enthusiasm.
Now let’s explore some of the other interesting districts in Fairfax County to see if we can either locate any new trends, or confirm some hypotheses already made. VA-6 stands out, as it simultaneously has a very deep green precinct next to a very purple one. What the heck is happening here? Well, it just so happens that the green precinct is very white (75%+) while the deep purple one is more diverse, and holds a very concentrated amount of Asian voters, which are the next largest ethnicity of the district (23%). VA-8 is quite fascinating, too, as it seems to be doing the best turnout-wise overall in the county. Demographically, the district is a plurality white (38%), with the next largest ethnicity being Latinos (28%). This seems to strengthen our findings that Latinos are, in fact, turning out, as if they weren’t, we’d be seeing much more purple around District 8. While I could spend more time breaking down the rest of Fairfax, the county has quite consistently matched the trends of Loudoun, while also adding a new hypothesis into the mix, which is weak black turnout. Let’s see if Prince William County makes or breaks our findings:
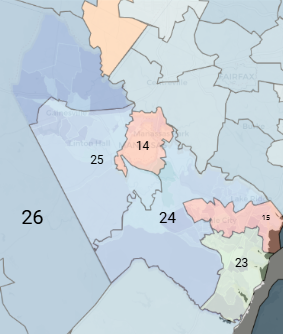
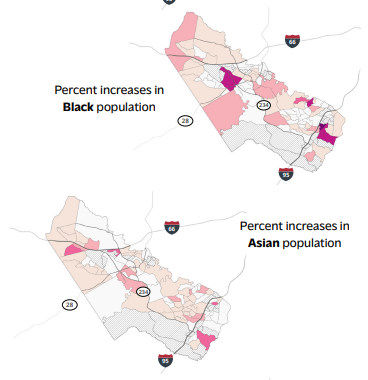
This is a very suburban county, with the majority of districts being such. Though unlike Fairfax and Loudoun, most are also classified as non-educated, which brings a new component into the mix when it comes to turnout. Let’s first look at VA-26, where some of the deepest purple areas of the whole county are. When breaking down the area by ethnicity, the north of the county is home to a sizable and increasing population of both black and Asian voters, which helps to explain the weak turnout while also providing more evidence to our previous claim that both Asian and black turnout is wavering.
Honing in on the black turnout issue, VA-23 happens to be a plurality black district (36%), which is the first one we’ve seen in the NoVA area. Turnout is very purple, especially in the southern and northern parts of the district where the black population is highest, while the whiter regions tend to be more green. In VA-14, there’s a much different story going on, as turnout is quite strong in Manassas city itself, which has a large Latino (42%) and white (37%) population.
Outside of the city, though, the parts of Manassas that make up Prince William County are more purple, and this could be attributed to the fact that VA-14 is classified as a non-educated urban district. VA-15 is very similar to VA-14, as it holds the same classification, while also being a plurality Latino (42%) district. The one noticeable difference, though, is that unlike Manassas, VA-15 has a very sizable black population (21%) located in the east of the state, where most of the purple can be found. The last two districts that stand out in Prince William County are VA-25 & VA-24, which happen to be somewhat similar in their classification, as they both are quite white (49% and 50% respectively) and are considered educated and suburban. One noticeable difference is that VA-25 has slightly more Latinos than VA-24, which seems to explain why there are fewer purple precincts in VA-25 when compared to VA-24.
Wrapping up the NoVA analysis, you can see a consistent trendline emerging:
- Asian voter turnout is lagging
- Educated white urban & rural voters are turning out
- Suburban turnout is lagging
- Latino voters are turning out
- Black voter turnout is lagging
- Asian voter turnout is lagging
- Uneducated voter turnout in general could be lagging
Southwest Virginia
Moving on from heavily Democratic northern Virginia, let’s now take a look at deep-red southwest Virginia, which is extremely rural and uneducated. The lower population of the southwest means fewer 100k districts and much larger counties, so the analysis here will be more big-picture. Looking at the southwest initially, we can see turnout is quite bad, especially in the westernmost parts of the state, which is not a great sign for the Earle-Sears campaign.
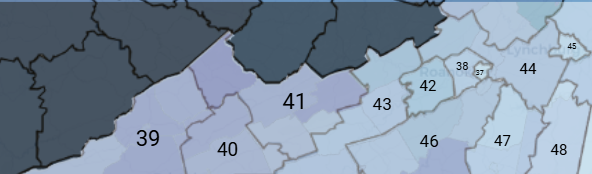
Looking at the ethnicity and classification of districts 39-41, we can see a consistent trend line that they are all very white (93%+), and are classified as rural and non-educated. This seems to correlate with our previous hypothesis that there might be a turnout issue among uneducated voters. This claim is further stressed in VA-27 & VA-48, which are also quite purple, uneducated rural districts. The only major difference is that both these districts have larger black populations, but because black voters aren’t turning out much anyway, the turnout percentage ends up looking about the same. Another broad trend highlighted in the southwest is that there is higher turnout in the more educated urban northern areas, which is part of the reason turnout is higher in VA-42 and VA-45.
Richmond
Moving farther northeast, we’ll now analyze the crucial city of Richmond, which should give us better insight on how black voters in specific are turning out.
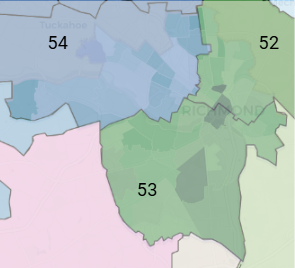
The first thing to note is the district with by far the most consistent turnout is VA-54, which happens to be a very white (78%+) district that is also highly educated and urban. The strong turnout here isn’t surprising, as it seems to line up with the trends we’ve already discussed.
VA-53 is another very interesting district, as you’ll notice the precincts on the east side are quite purple, while the precincts on the west are very green (especially in the north of the district). This tracks very closely with the dispersion of black voters within the district, as the more diverse and less black the neighborhood, the higher the turnout.
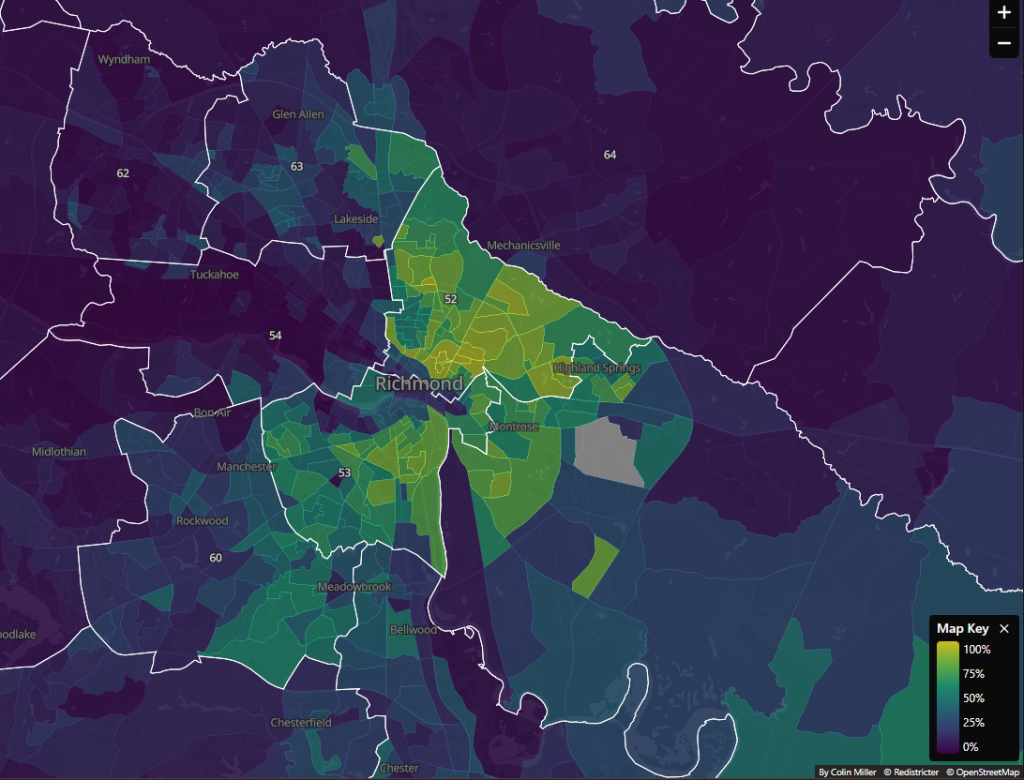
VA-52 is the same way, as the southeast and center of the district (which comprises the most black voters) has the lightest shades of green and the most purple out of the entire district, while the northwest (which is much whiter) is quite green overall.
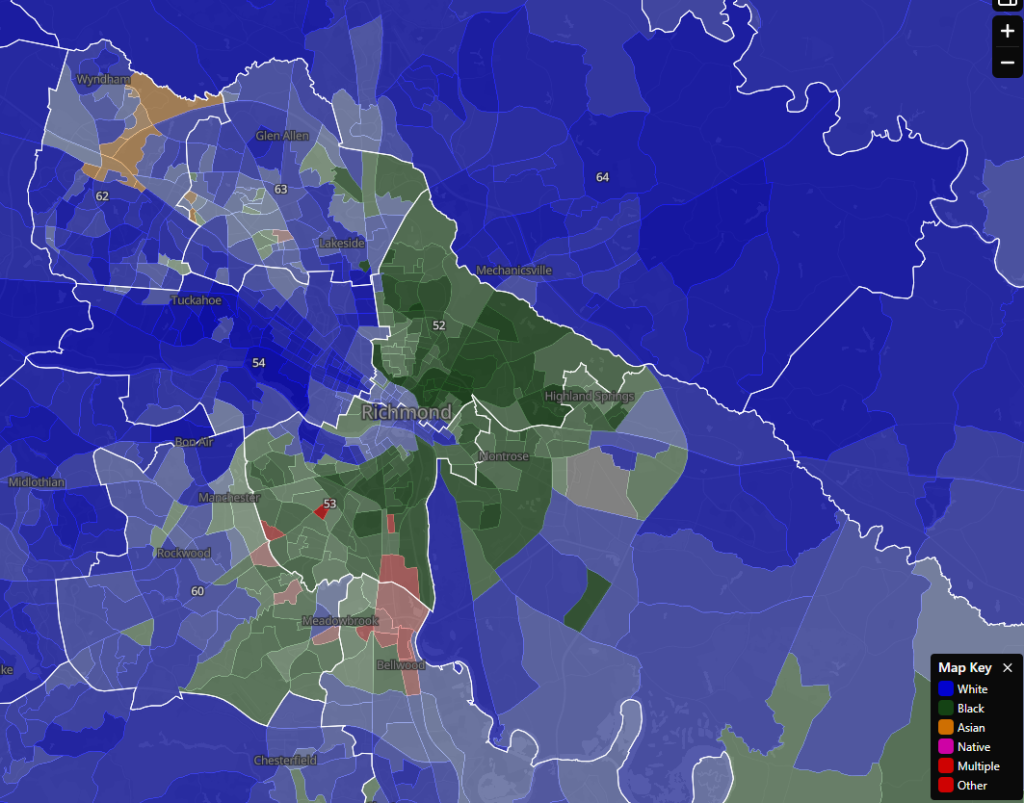
Factoring in Latino and Asian voters too, we can see that some of the deepest purple in VA-52 is located in Asian-heavy neighborhoods, while some of the better turnout in VA-53 is coming from Latino-heavy neighborhoods. It’s also important to note that both VA-52 & VA-53 are classified as majority black, and are un-educated and urban, which reinforces the claims made previously.
Virginia Beach/Norfolk
The final region we’ll look at is the southeast, with a focus on two cities that are a part of what is known as the “Hampton Roads” region of the state. First, let’s take a look at Virginia Beach, as it happens to have some interesting demographic data to take a look at.
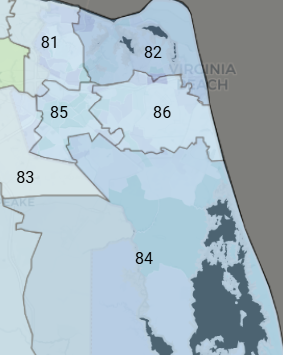
VA-84 has some of the strongest turnout in the county, and it should be no surprise as to why, as it’s a heavily white (69%+), educated rural district. The darker purple area in the south of the district can be explained also, as blacks (12%) are the second-largest ethnicity in the district, and they’re concentrated in that area.
The next best districts when it comes to turnout are VA-85 & VA-82, which are both classified as educated urban majority white districts, continuing the trend that these types of voters are turning out quite reliably.
The interesting part comes when we factor in the remaining districts, which are all classified as non-educated urban. We;’ve only seen this classification so far in plurality black districts, and none of these are significantly black (besides VA-83).
VA-86 is the most white (54%) of the three remaining districts, and as such, turnout there isn’t as bad as the other non-educated urban districts. Despite the fact the district is whiter though, turnout is still quite bad, as there seems to be a consistent trend that uneducated urban and rural voters just aren’t turning out.
VA-81 solidifies that claim, while also mixing in the component of race too, where whites barely make up the majority (51%), with blacks (29%) the second-largest ethnicity. This combination ends up making turnout in this district quite bad, as it combines the pre-existing black turnout problem with the lack of enthusiasm among non-educated urbanites.
VA-83 is the extreme version of this unsavory turnout mix, as it is plurality white (45%), while blacks (37%), are the second-largest ethnicity by a lot. Despite the sliver of VA-83 that is a part of Virginia Beach county, nearly every precinct is purple, thanks to the unfortunate demographic makeup of the district.
Moving north to Norfolk city, there’s a lot of purple precincts, but why?
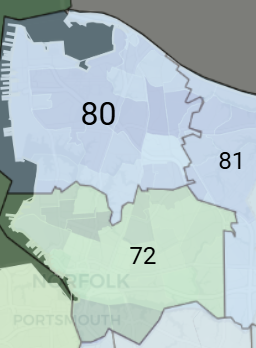
Well, let’s first look at VA-72, which happens to boast some of the deepest purple areas in the south and northwest of the district, while also having more stable turnout in the center. This is likely due to ethnicity, as VA-72 is majority black (55%), with a sizable white population (32%). As such, like in Richmond, this distinction between precincts is in part due to how race is dispersed throughout Norfolk, as the black population is concentrated in the darker purple precincts, while the more diverse precincts tend to be better performing when it comes to turnout. Overall though, given that this district is classified as non-educated and urban, turnout isn’t great in general. VA-80 & VA-81 rhyme that story, only instead of being majority black like VA-72, they happen to be both just barely majority white (51%), with blacks trailing behind as the second-largest ethnicity. We talked about VA-81 a bit earlier in the article, as parts of it were in Virginia beach, but the analysis remains the same: combining the pre-existing black turnout problem with the lack of enthusiasm among non-educated urbanites in general creates very purple precincts. VA-80 is the same story.
So, in wrapping up our analysis, we’ve found pretty convincing trends of the following:
- Asian voter turnout is lagging
- Educated white urban & rural voters are turning out
- Suburban turnout is lagging
- Latino voters are turning out
- Black voter turnout is lagging
- Asian voter turnout is lagging
- Uneducated rural & urban voter turnout is lagging
Uneducated rural white voters not turning out is especially important when you consider the fact that those types of voters are often cited as the “MAGA base,” and given Earle-Sears never received Trump’s endorsement, she might be struggling with them as a result. This “MAGA base” often stays dormant unless Trump is on the ballot anyway, so this is a particularly bad combination for Earle-Sears.
Perhaps Earle-Sears can make up the difference with strong turnout among educated rural white voters, which, based on the analysis, seems possible. She could also benefit from low black and Asian enthusiasm, as those voters often vote Democratic (though I should note Asians did shift to the right by quite a bit in 2024).
As for Spanberger, the best news for her is that educated white urban voters are turning out heavily, as well as Latinos. The latter is somewhat surprising given minorities usually turnout at lesser rates during off-year races, but they may have been motivated to vote in protest to Trump’s controversial immigration policy. Spanberger’s main problems, based on the data, are low Asian and black turnout, which could be negated in part by persuasion among white voters. Weak suburban turnout is a possible issue for the Spanberger campaign, too, as that demographic is expected to break heavily in her favor. Though she’s turning out urban voters enough that it may not make a huge difference.
In conclusion, to generalize all the data discussed, the electorate in Virginia this cycle will be whiter, better educated, and more urban than in 2024, based on the early voting data we have so far.
Written By: Ceartin from the ElectionCord Discord.
Resources:
Early Voting Data: https://projects.statenavigate.com/25-26/states/va/voter-registration