
We recently added our 400th poll to our averages, and by reading through so many polls, we’ve figured out which polls are high quality, and which ones are not. We’ve compiled the things we’ve learned here, in the form of 5 questions you can ask yourself when looking at any poll. Polling is an inexact science that pollsters are trying to improve on everyday. By thinking about the questions posed here, you can navigate your way through all the polls you see on social media. Knowing which polls are high-quality polls, and which ones aren’t will help you get an inside look at how the next election might go.
What is the purpose of the poll?
Polls that are sponsored or done by non-partisan groups or media outlets simply looking to gauge opinion will be more trustworthy and higher quality. As stupid as this might sound, it’s important to keep this in mind, as they’re not trying to push any agenda or points. Take, for example, Marist College’s poll. Marist College is a private, secular school not affiliated with any religion or political party. Their polls are usually sponsored by unbiased news organizations like NPR and PBS, for the purpose of gauging public opinion.
An example of a poll that is trying to push an agenda is the recently released Bullfinch Group/Independent Center Voice poll. This isn’t any kind of indictment on Bullfinch Group, but the sponsor, Independent Center Voice, is a centrist organization that supports independent candidates. The title of the poll on their website is “As America Approaches its 250th, Voters Declare the Status Quo ‘Broken’ and Demand New Options”. While that may be true, the way they said that certainly insinuates they think one way, and the questions they ask even show that.
What kinds of questions do they ask?
Speaking of which, an example of a bad question is one that could be interpreted in different ways, or one that is specifically trying to achieve a desired outcome. In the Independent Center Voice poll, they asked the following question:
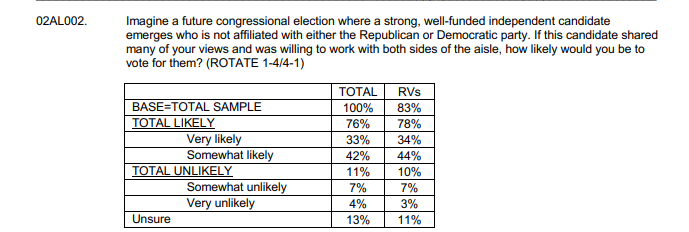
The issue with this question is that it’s a complicated question, and also seems to be looking for a desired outcome. It can also be interpreted in many ways, and could even be confusing to respondents. The idea of polling is not to justify your beliefs and opinions, but to let the answers in the poll drive conclusions and thoughts.
So what is an example of a good question then? Take this one from the New York Times/Siena survey done in September of 2025.
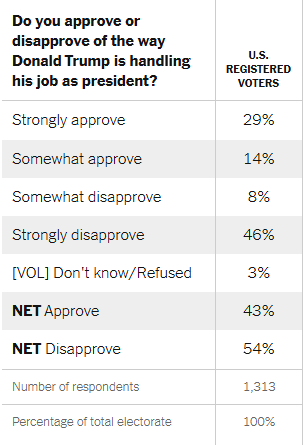
The question is very simple and can only be determined in one way, so everyone will answer it with the same understanding. It’s also not trying to push any kind of agenda, and simply wants to know if respondents approve or disapprove of how President Trump is handling his job. They did not set out to justify their belief that President Trump must be popular or unpopular, but rather asked the question in a neutral way.
Generally speaking, simple questions are better, given that there is depth and value in that question, like asking about President Trump’s approval, the state of the economy, the 2026 Generic Ballot (Who will you vote for in the House in 2026), and Congressional Approval. Depth in a question can also come from the crosstabs, or asking about how President Trump is handling specific issues, like the economy or immigration.
Do they show their work?
Do you remember in math class in school, having to show your work? It was probably annoying to do this, but there was a very good reason for it: to make sure the teacher knew you knew how to solve the problem, and you weren’t just cheating or guessing. With polls, the same concept can be applied, among other things, to crosstabs. Crosstabs are really just splitting up respondents by demographic, like age, gender, and political party. They’re useful to know what specific demographics may be thinking, but they’re also very useful in figuring out how a pollster got a specific answer to a question.
We can use 2024 results, combined with polling averages for each demographic, to get a baseline for what passes the smell test. Take, for example, this question in the recent YouGov/Economist poll, asking about who participants will vote for in 2026.
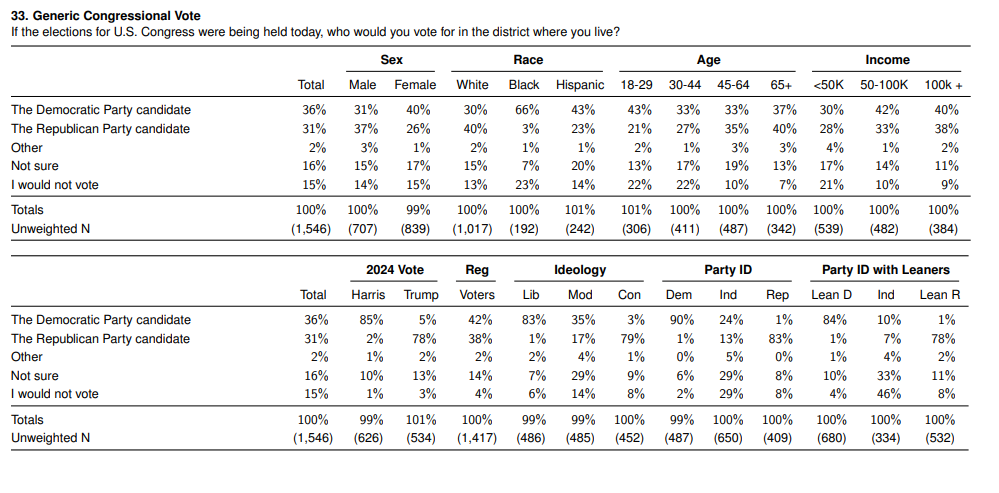
For the most part, all of these crosstabs line up with ElectionCord’s crosstab average, and most demographics’ results line up close to our prior expectations. As an example, they’re showing that younger people and women lean Democratic, while older people and men lean Republican, which tracks with our averages. Of course, polls don’t have to be that close to our averages, as they’re simply snapshots with a limited number of respondents, but the idea is that they should be within about 10 either way.
By comparison, here’s a recent poll by AtlasIntel that really doesn’t make sense. When asked about who participants will vote for in 2026, they got an answer of Democrat +16%, which would be nothing short of remarkable. As a comparison, the largest House margin in this century was Democrat +11% in 2008, and our averages have about a Democrat +4% win as of January 2026.
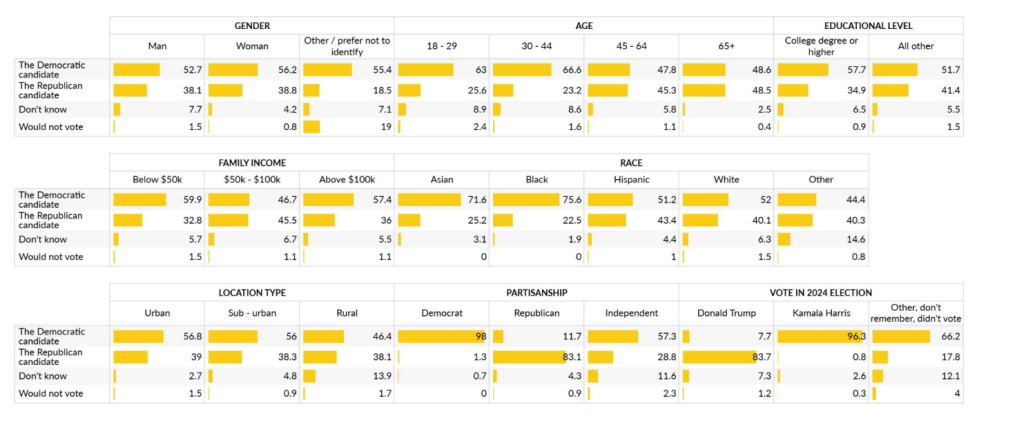
If they got such an outlier result, it’s valuable to see their work and see how they got there with crosstabs. There are a few clear things that really make no sense, like rural people voting for Democrats, and Hispanic people actually being to the right of White people. Even with Hispanic people shifting towards Republicans in recent elections, we estimate they voted 26% to the left of White people in 2024, so this result in 2026 is, well, highly unlikely. Just by looking at the crosstabs, we can quickly see that an outlier result has some very strange reasons for getting to that answer, and should be viewed with a lot of suspicion.
What is the kind of sample they use, and what is the sample size?
Generally speaking, political polls have three types of samples: Adults, Registered Voters, and Likely Voters. It’s important to know what type of sample each poll uses, because it can make a big difference depending on the question being asked. As a quick breakdown, adults are just a sample of anyone in the US over 18, registered voters is anyone who says they’re a registered voter, and likely voters are people who are registered and say they are likely to vote in the next election. The only time when this really matters are polls asking about specific elections, like people’s preference for Congress in 2026 or President in 2028. Generally, polls with samples with likely voters will be more accurate in the months leading up to an election, with registered voters being fine when an election is a year or more out.
One other thing that’s important to note is when asking about respondents’ preferences for who they support, the possible answers are usually something like, a Democratic candidate, a Republican candidate, and some form of “don’t know” and/or “not voting”. In the days and weeks leading up to an election, pollsters should be trying to get as few people in those later categories as possible, by either weeding out people who aren’t going to vote (Likely Voters), or by pushing undecided voters if they are committed to vote. It’s not particularly useful if 10-15% of people in a poll are undecided a week before the election, and it’s exceedingly rare that that many people are actually undecided that close to the election date.
Finally, let’s touch on sample size. Sample size is just how many respondents a poll had, and the number can vary depending on the scope and specificity of the poll. It really doesn’t matter as much as you might think, because according to G. Elliot Morris and FiftyPlusOne, “additional interviews (respondents) have diminishing returns after a certain point.” In other words, 2 polls that had the same exact methodology except for the fact that one had a sample of 2,000, and the other had a sample of 20,000, their end results wouldn’t be meaningfully different. That being said, samples should be at least above 500 in state-level polls, and above 1,000 in national polls.
What kind of weights do they use?
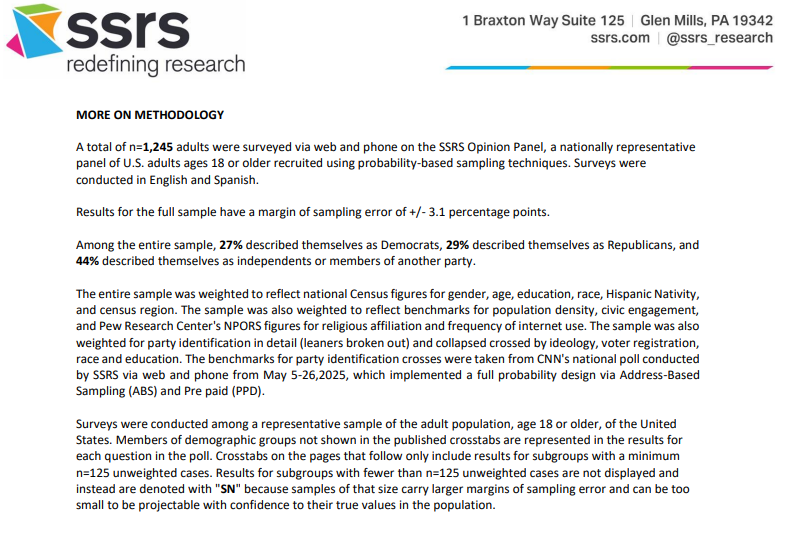
One more thing about polling is that they do not simply take a random sample of a certain number of people and just use that as the final result. The reason is that you won’t get a sample that accurately matches US demographics with only 2,000 people, and certain demographics are just more likely to respond to polls. The way pollsters will weigh demographics is pretty complicated, but the short of it is that they will line it up to the US as a whole based on stuff like ethnicity, age, education, and gender. Most poll releases will talk about their methodology, and include the sample size, sample type, and how they go about weighing their poll. Just as an example, this is from CNN/SSRS’s poll from October of 2025.
In addition to weighing by demographic information, pollsters will also weigh by political affiliation or previous elections, like the 2024 presidential election. However, weighing polls for the 2026 elections based on how people voted in, say, 2024 may not line up with the electorate in 2026. It’s entirely possible that among voters who will vote in 2026, Kamala Harris won a plurality or majority of them in 2024. For 2025, it’s fine to weigh based on the 2024 vote, but as we get farther back from that election, pollsters should start to put less emphasis on how people voted in 2024 in their weights.
Other Notes
Check the date of when a poll was done, which is different from when it was released. Sometimes polls can be released after it was recorded.
Polls that have outlier results are not inherently bad, it just depends on how they got there, as noted in the “Do they show your work?” section.
Resources
https://fiftyplusone.news/methodology
https://s3.documentcloud.org/documents/26211915/cnn-poll-trump-midterms-east-wing-parties.pdf
https://atlasintel.org/poll/usa-national-2025-12-19
https://d3nkl3psvxxpe9.cloudfront.net/documents/econTabReport_h1aYmmb.pdf
https://maristpoll.marist.edu/wp-content/uploads/2025/12/NPR_PBS-News_Marist-Poll_202512121052-1.pdf